 |
 |
|||||||||||||||||||||
|
So what sorts of things have I made throughout the years? Here's a few of them.. Click on the screenshots to see larger versions of them. You can also download some of smaller ones that I had room for on my server.
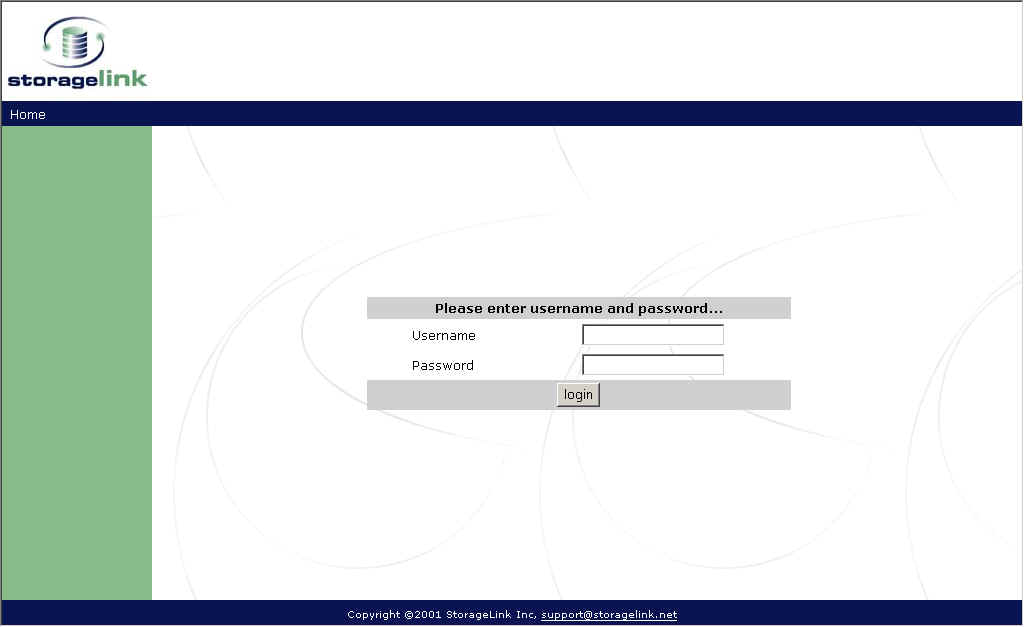
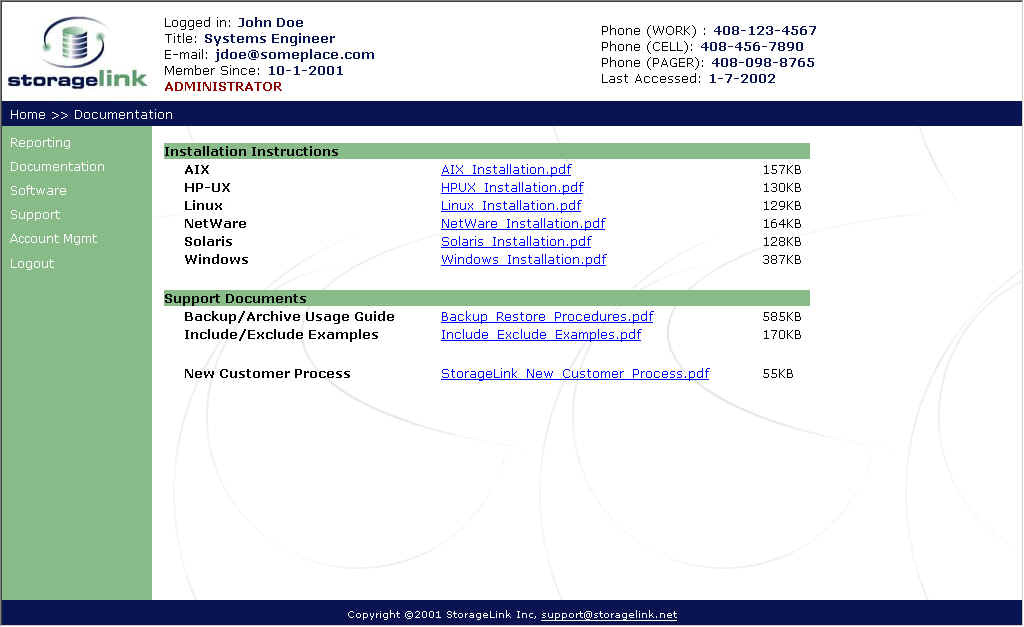
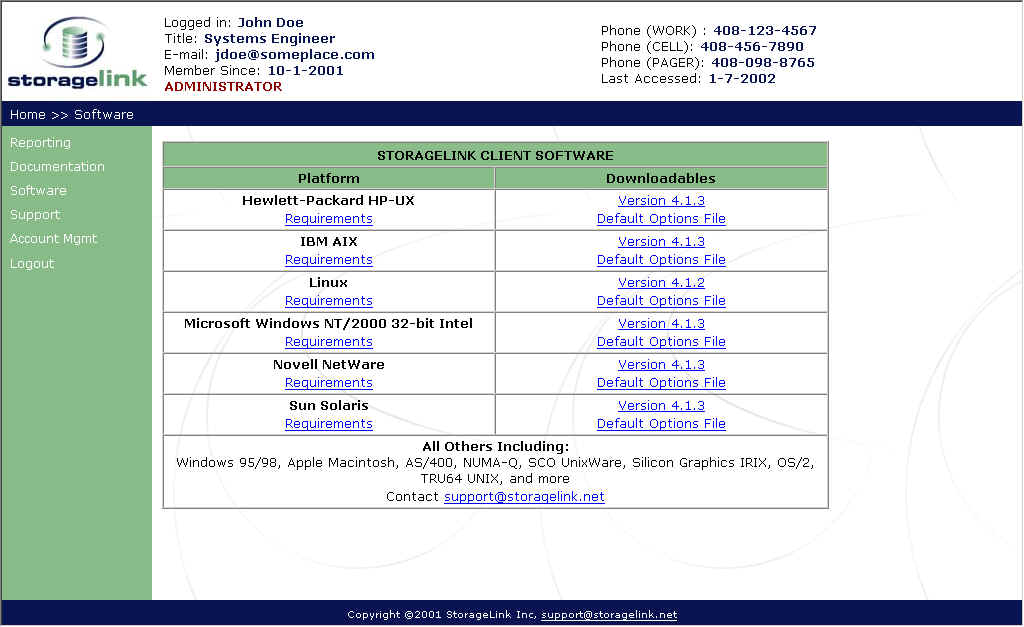
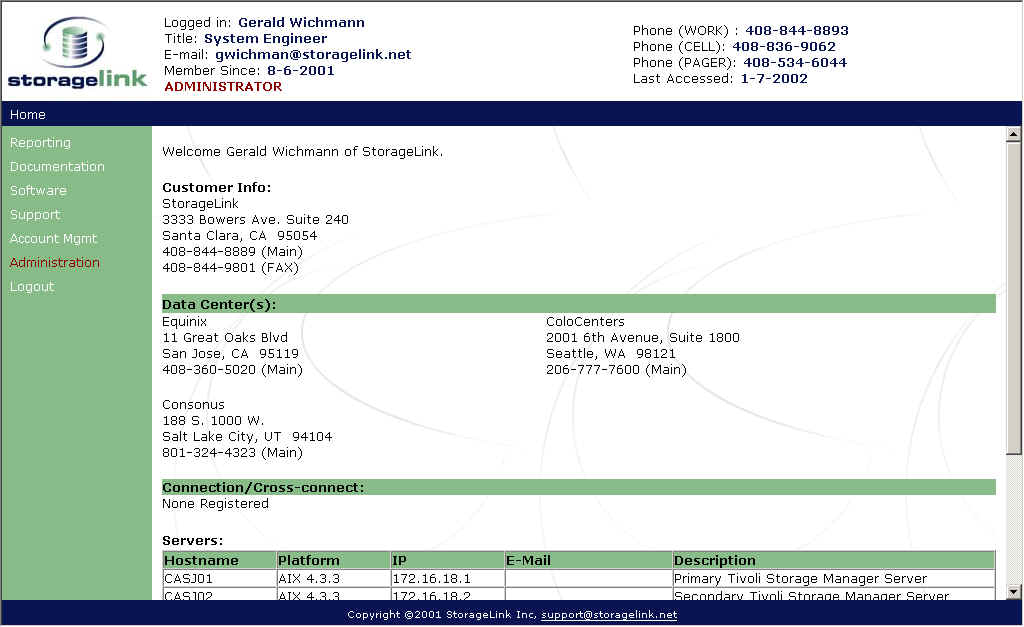
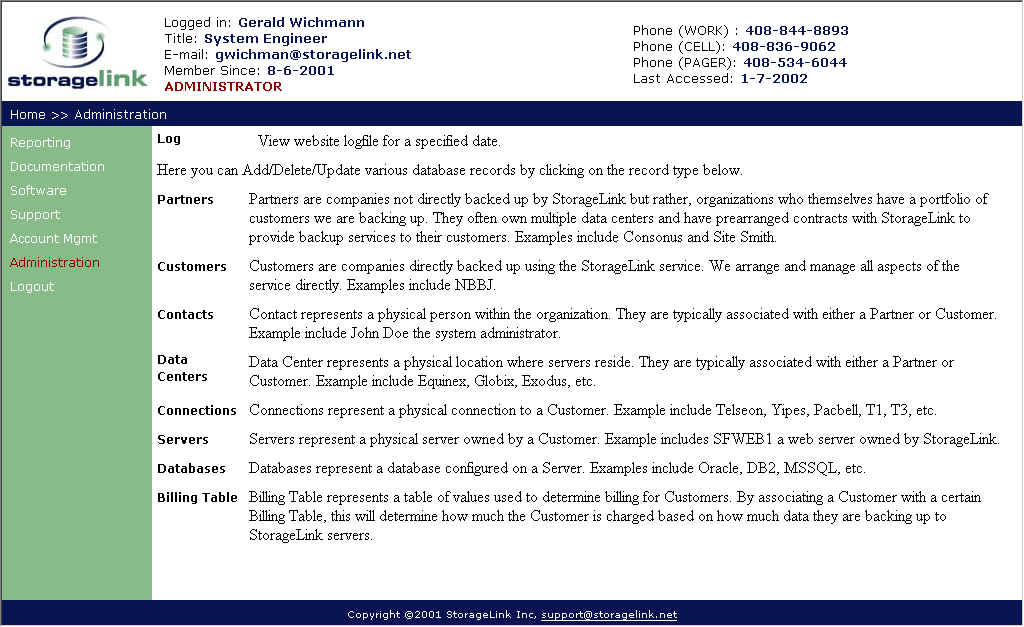
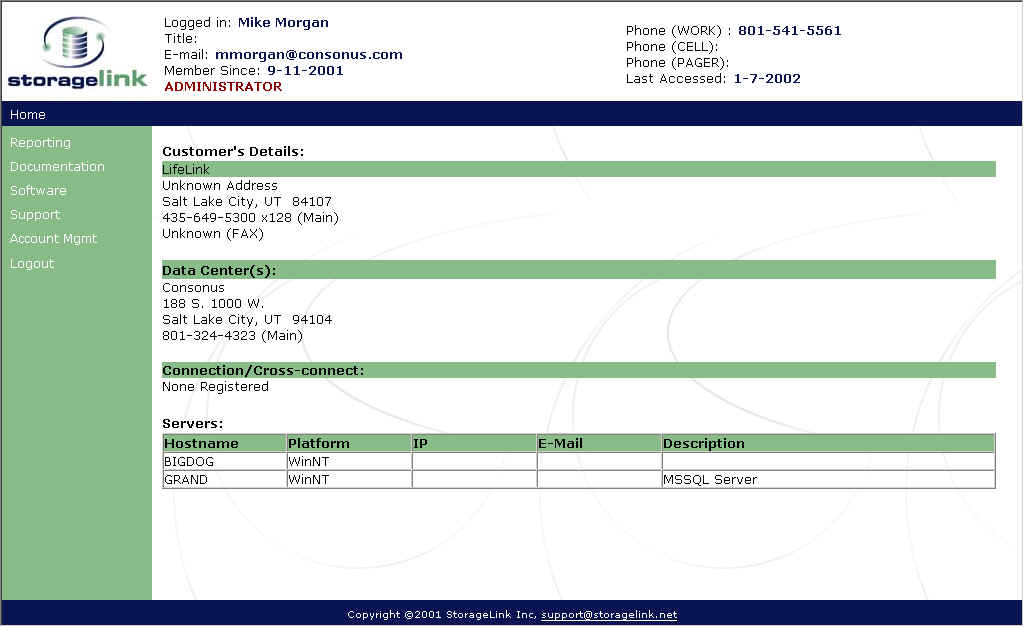
Provided a web portal for StorageLink which leveraged J2EE, Servlet, JavaBeans, and JSP technologies. Web Portal interfaced via JDBC connections to 5 different databases in order to generate daily and monthly reports. These reports are for customers and internal use covering storage use and successful backups. Reports also included server health statistics and handled monthly billing.
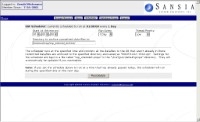
Daily Server Health Report Note the above reports are HTML e-mails. The top is received by StorageLink engineers daily while the bottom is what a customer would receive.
left - login screen
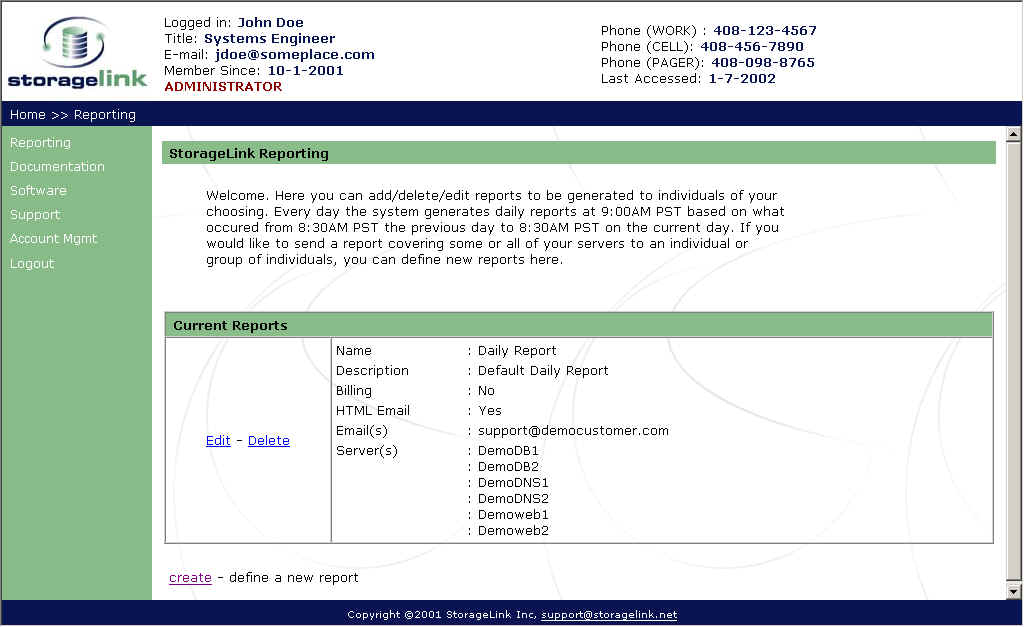
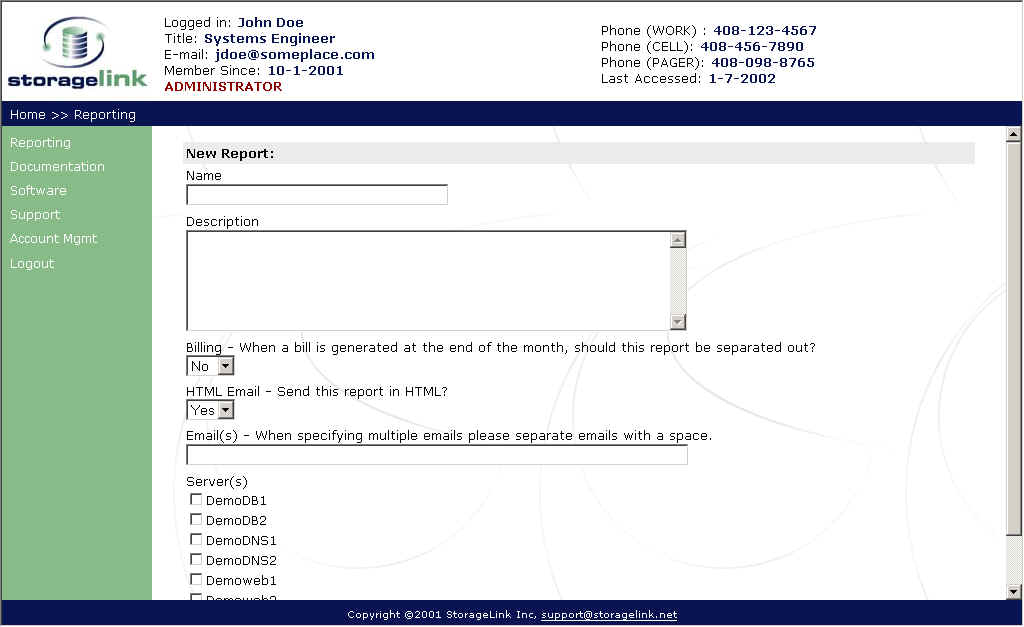
left - reporting screen - creating a new report
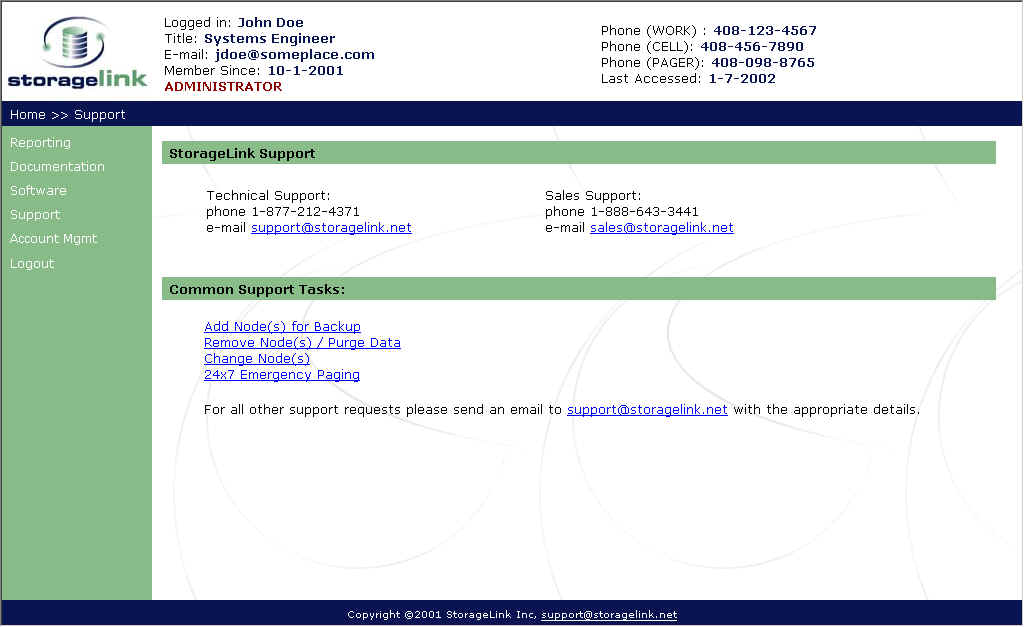
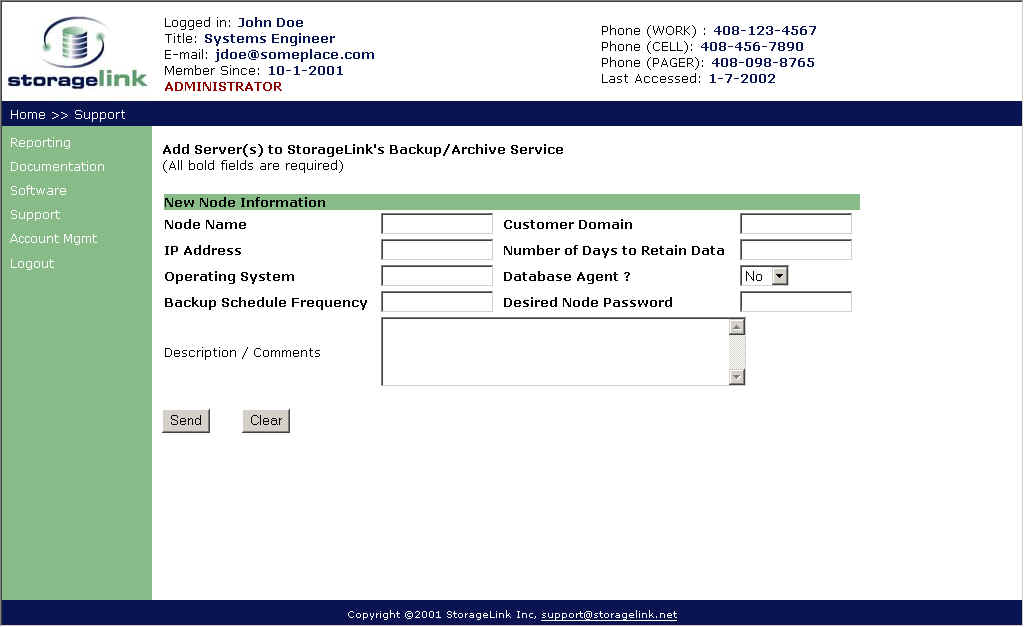
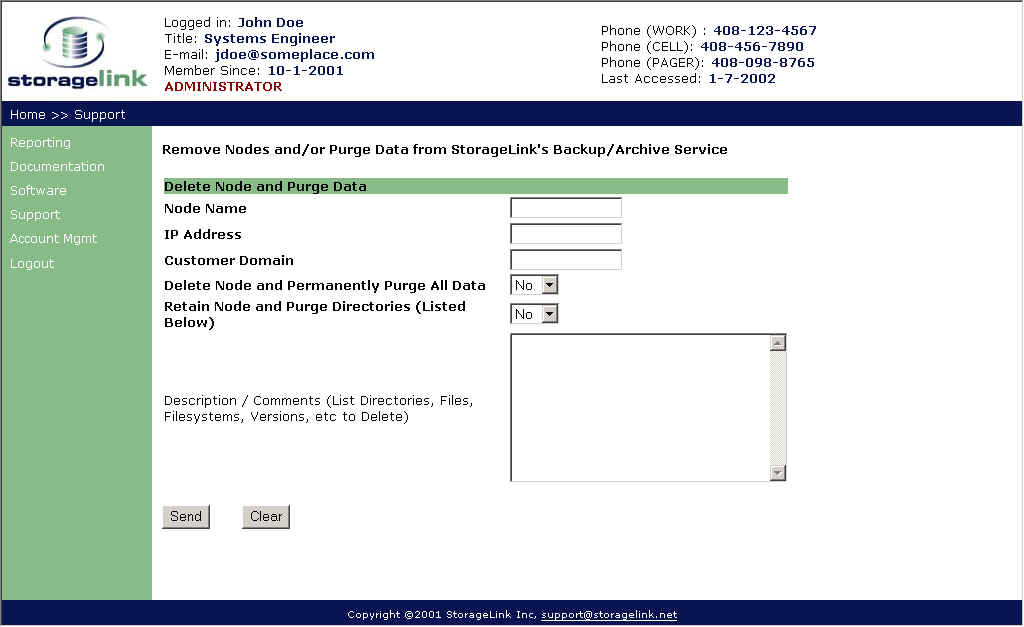
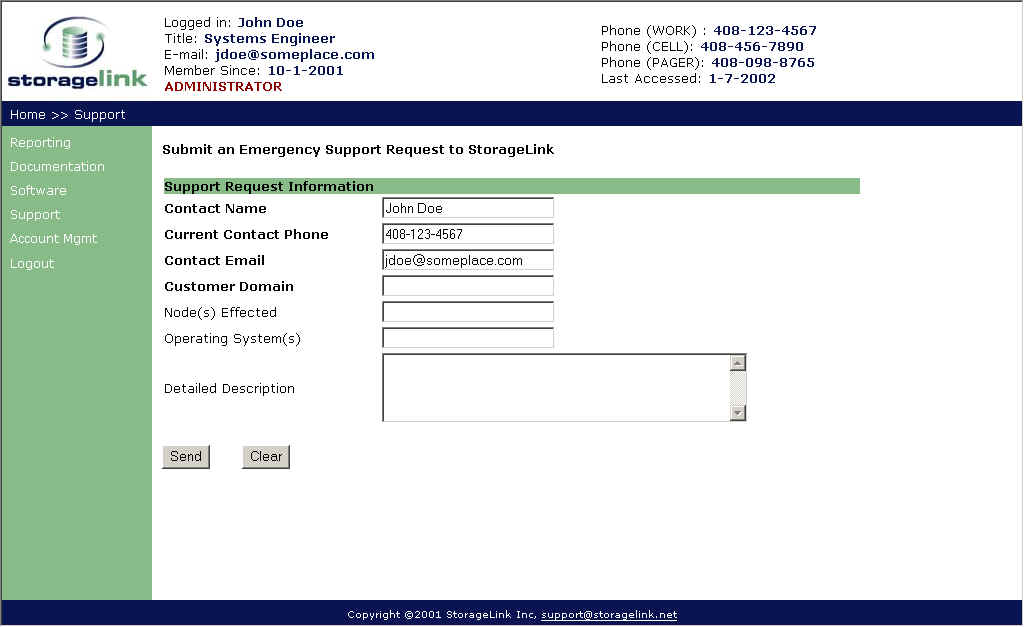
left - support screen - initiate various actions which submit tickets
to the StorageLink ticketing system
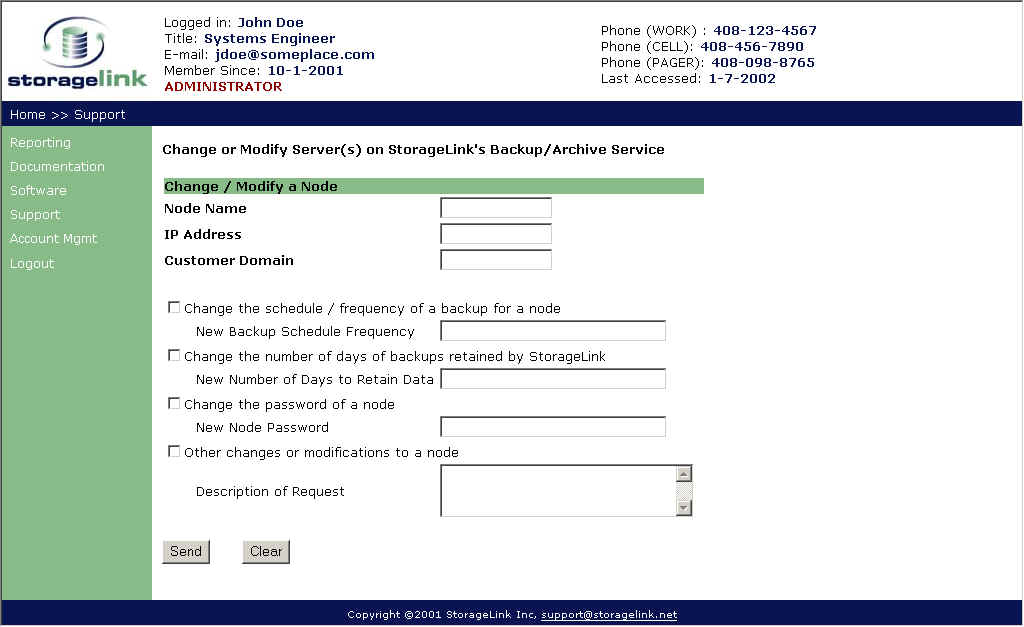
left - change/modify server screen - change or modify some server's
backup options
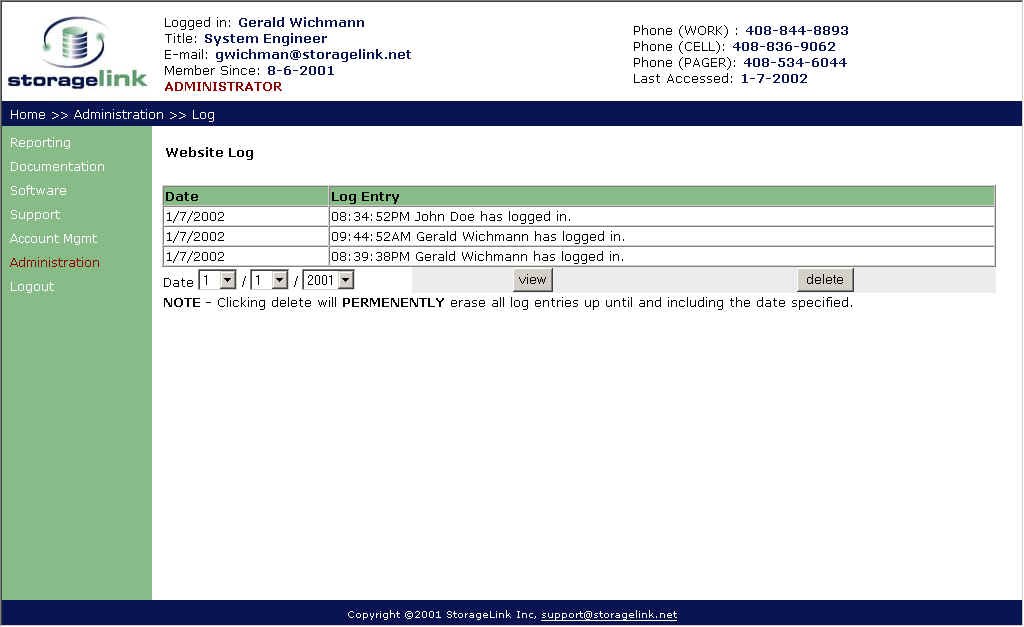
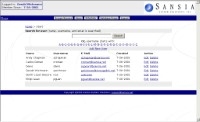
left - website log screen - shows users who've logged into the website
and when
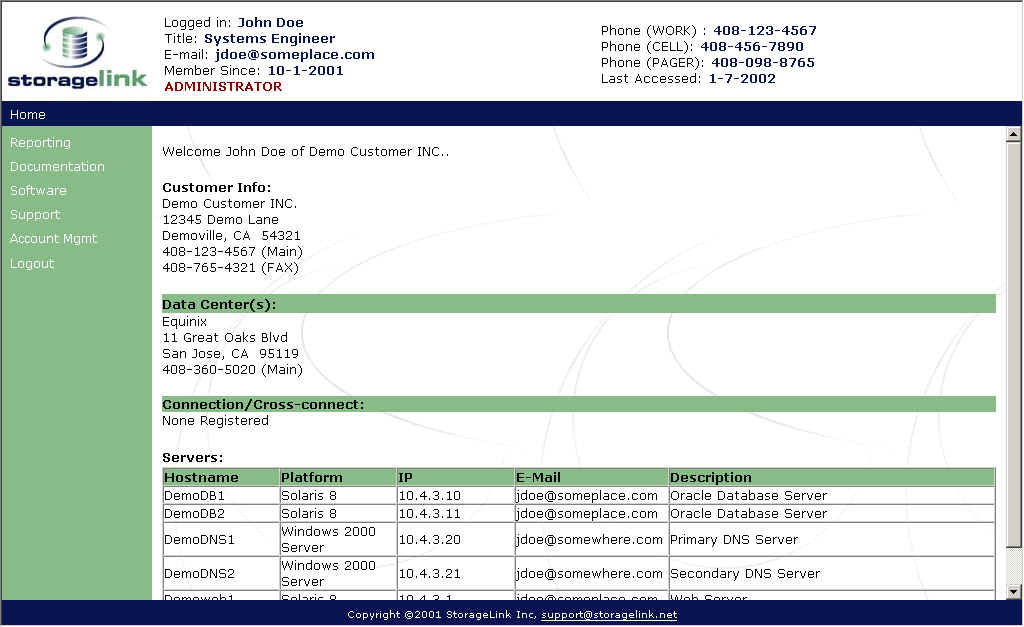
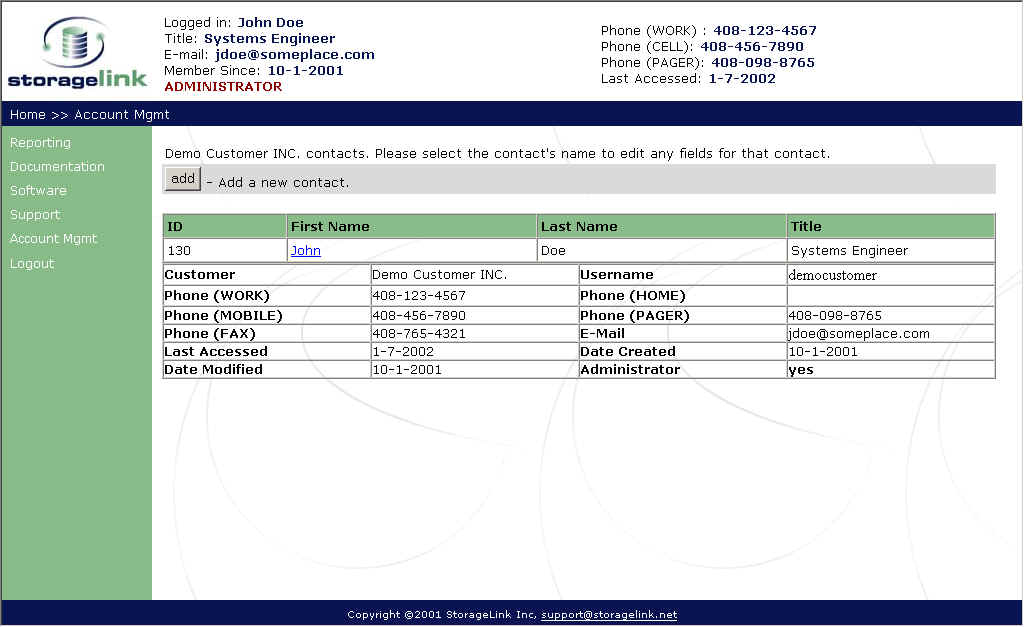
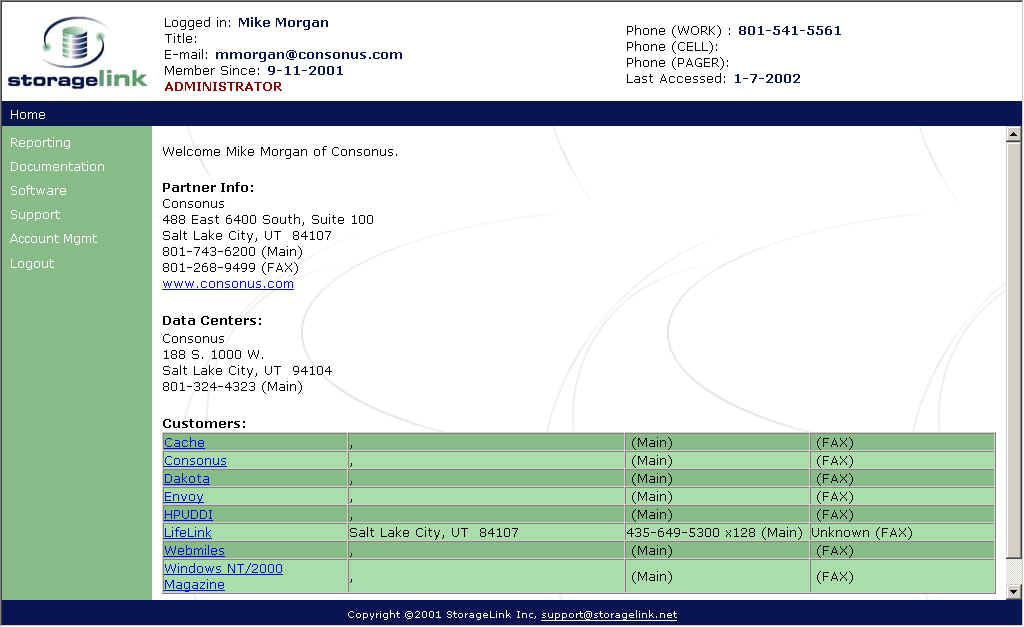
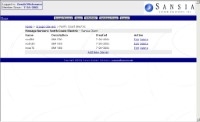
left - home screen for a user who is a partner of StorageLink. Note
the partner has multiple customers registered whom he can manipulate. For
example, the partner could give website access to customers and setup
reports without involving StorageLink personell
The applet below has been rewritten from scratch as a J2EE application. Before it's database consisted of flat files and the applet had to be downloaded to be used. Also there were limitations in that Java 2 Runtime support was needed to run the applet. By rewriting it as a J2EE application I was able to move most of the load off the client side, store all data into a proper database, and eliminate the need for the java runtime to be downloaded and installed. It also provided for increased functionality in that you could plot graphs over customized ranges of days to look for trends and anticipate needed upgrades.
left - log in screen
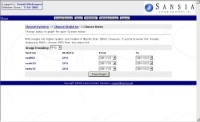
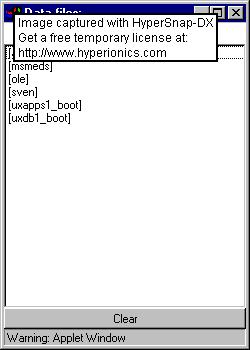
left - groups-servers screen showing servers for a customer
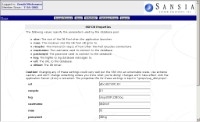
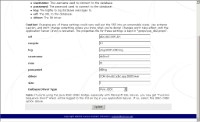
left - database props file where you can configure database related
information
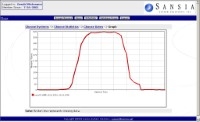
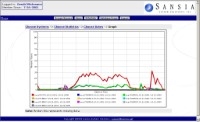
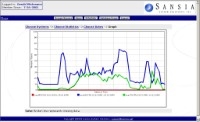
left - a graph of the number of users on a particular system for a
particular day. This data was taken from an IBM S70 which typically has 600+
users daily. You can see what time they start logging on and when they go home.
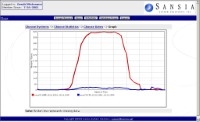
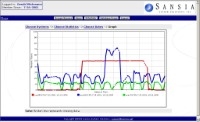
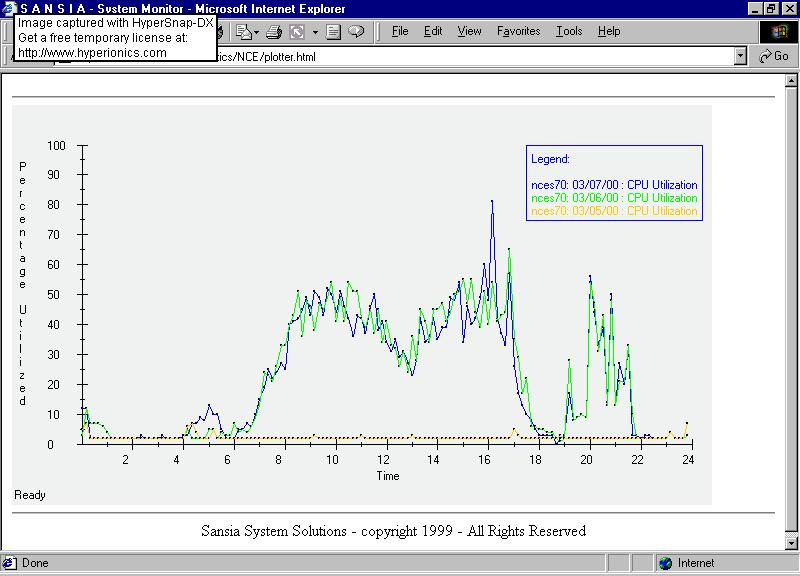
left - comparing CPU load on 3 different production servers. An IBM
S70, F80 and H50
Working for Sansia has got me working on a small side project in the form of a Java applet. You can check out the current version here. On many of our client's UNIX boxes there are a series of scripts which collect data on a daily basis and ftp that data to our website. The Java applet then allows a user to select what data they wish to see and plots it on a graph. This way, users can see what the load is like on their system throughout the day. The thumbnails above show screenshots of v1.0. The leftmost one shows a view of several systems for which there is data. This is the interface you use to select which system you'd like to look at and which set of data. The center thumbnail shows the number of users on the particular system throughout the day in graph form. You can see when people log on and start using it and when they go home at the end of the day. The rightmost thumbnail shows 3 days worth of CPU utilization on the same system (i.e. how hard the CPU is being hit at various times of the day). Other data can also be plotted. Version 2.0 which will be wrapped up soon, sports a much cleaner and more intuitive interface.
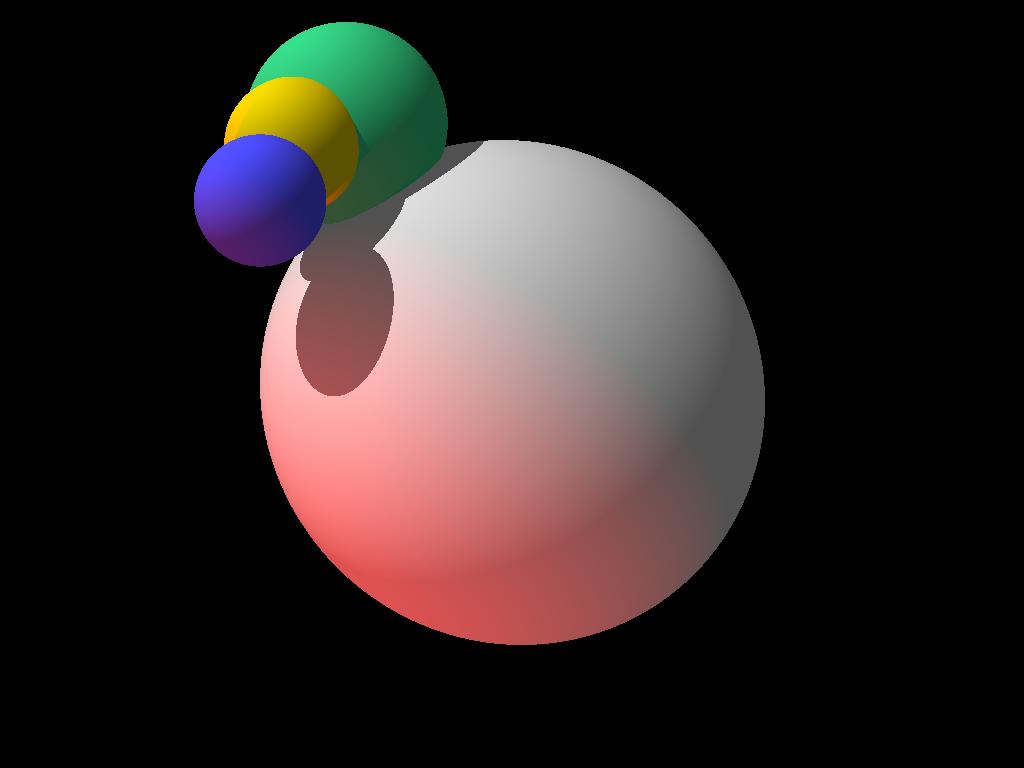
As part of an advanced graphics rendering course at Cal Poly, we developed an object oriented ray tracer from the ground up. This one is written for Unix/Linux and X-Windows although it easily translates to any other platform as the only function call needed is one to color a specified pixel on screen. Here are a serious of screenshots from the progressive development of the ray tracer:
The first assignment. Ray trace a sphere with ambient light and one point light in the scene.
The second assignment. The ray tracer must now be object oriented with multiple spheres of different colors and sizes. Objects now cast shadows and the scene includes multiple point light sources.
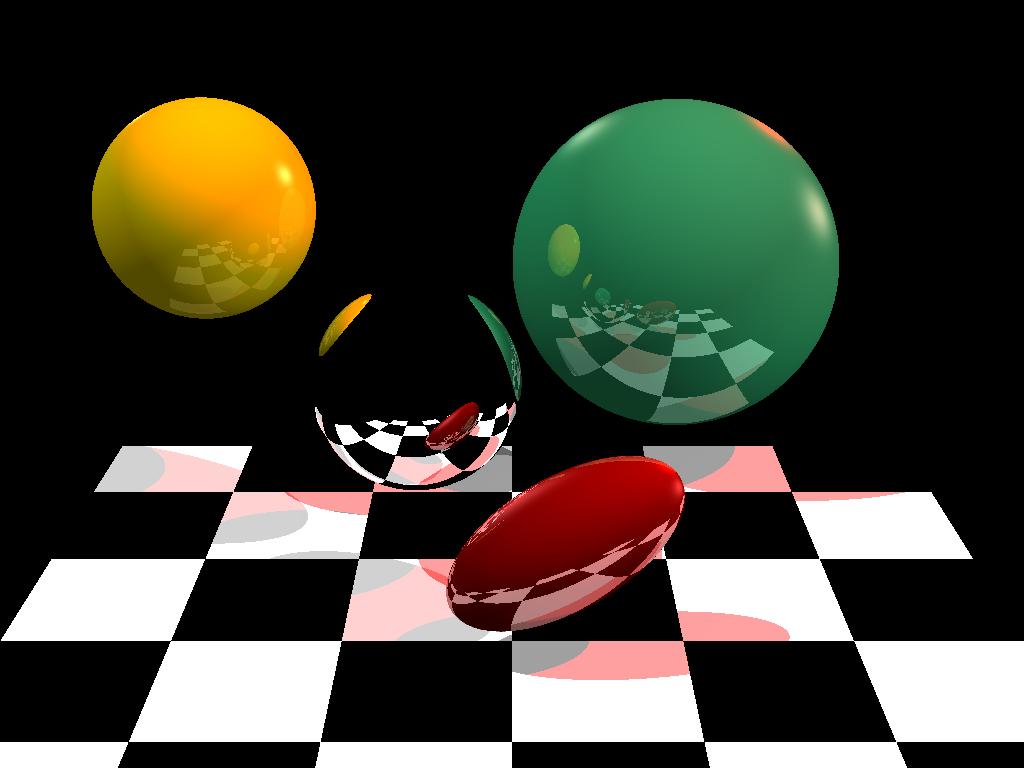
The third assignment. The ray tracer now has two additional objects, a board (or plane) and ellipsoid. A new texture that creates a checkerboard pattern on a surface also exists. The most impacting additions though are the additions of reflection and soft highlighting. This allowed me to easily create a mirrored texture.
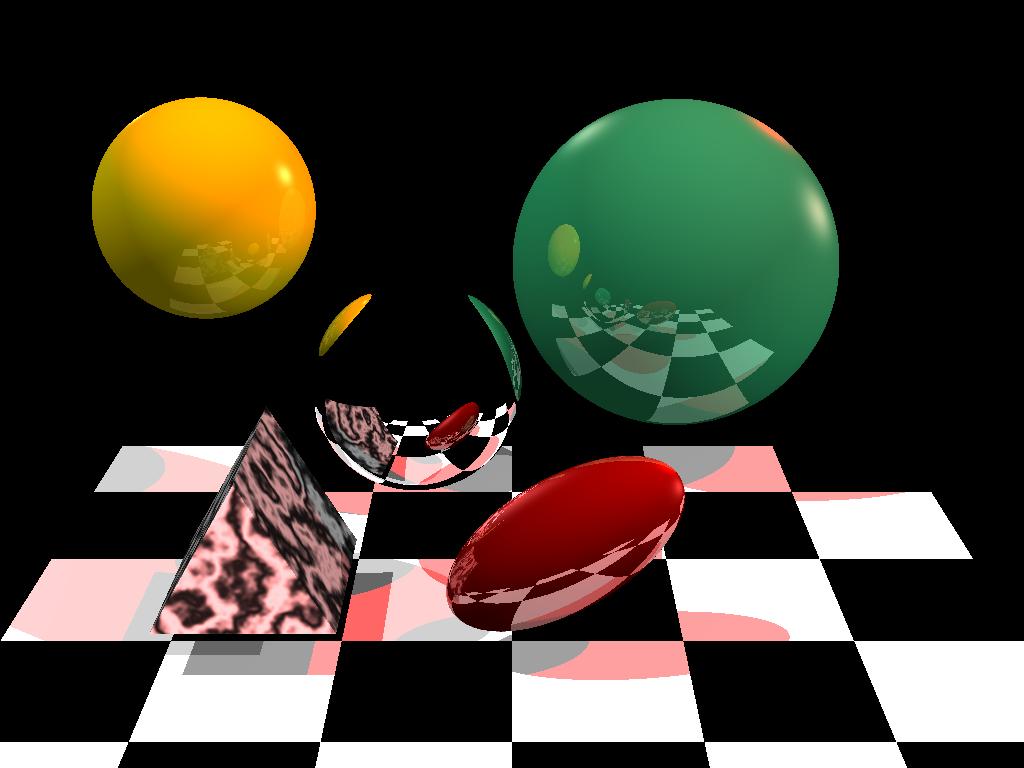
The fourth assignment. The ray tracer now has an additional object which is a 5 sided prism. It also now supports solid textures which is the marble texture applied to the 5 sided prism. A solid texture differs from the previous textures in that you must create a lattice that stores the values of the texture, and then interpolate the coloring based on where the object is in the lattice. In a sense, the object is colored as if it were cut out of the material which is a lot different then the previous textures in the way they're handled (much simpler).
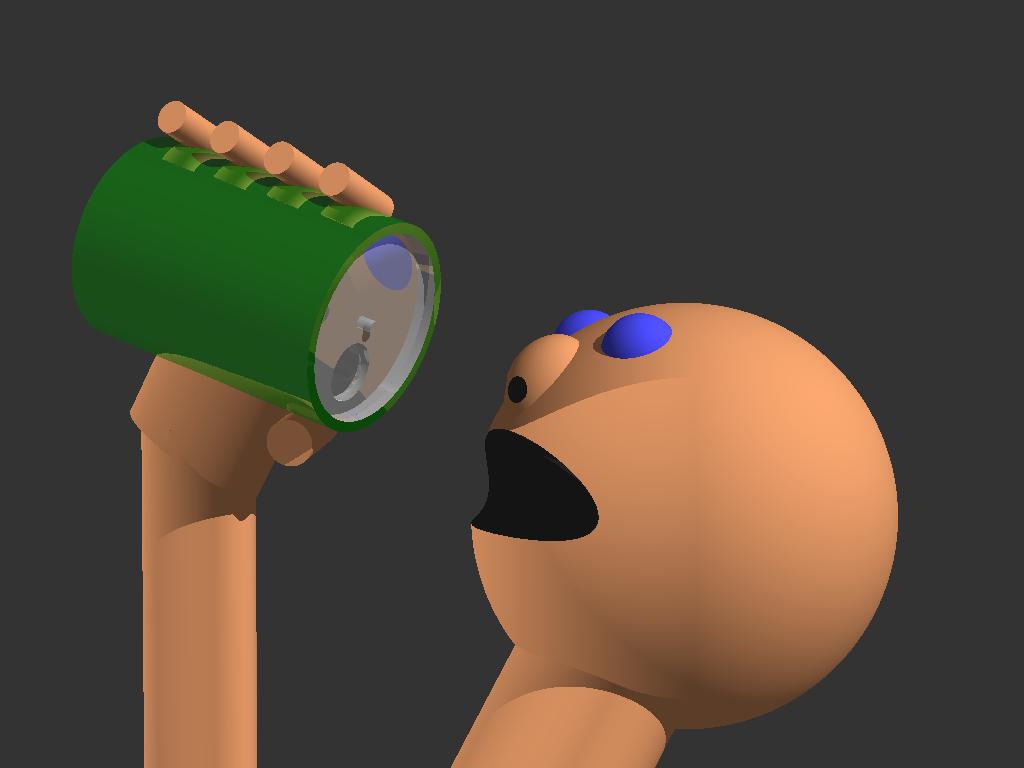
The fifth and last assignment. Here the objective is to create a fairly non-trivial scene that uses compound objects. Compound objects are those that take several simpler objects and add or subtract them from one another to create a more complicated object. Notice the can which is essentially a cylinder, with a smaller cylinder cutting out the interior of the can while an ellipse cuts out the small hole. The top rim of the can is again made by subtracting another cylinder from the top of it. Careful alignment creates a decent looking can.
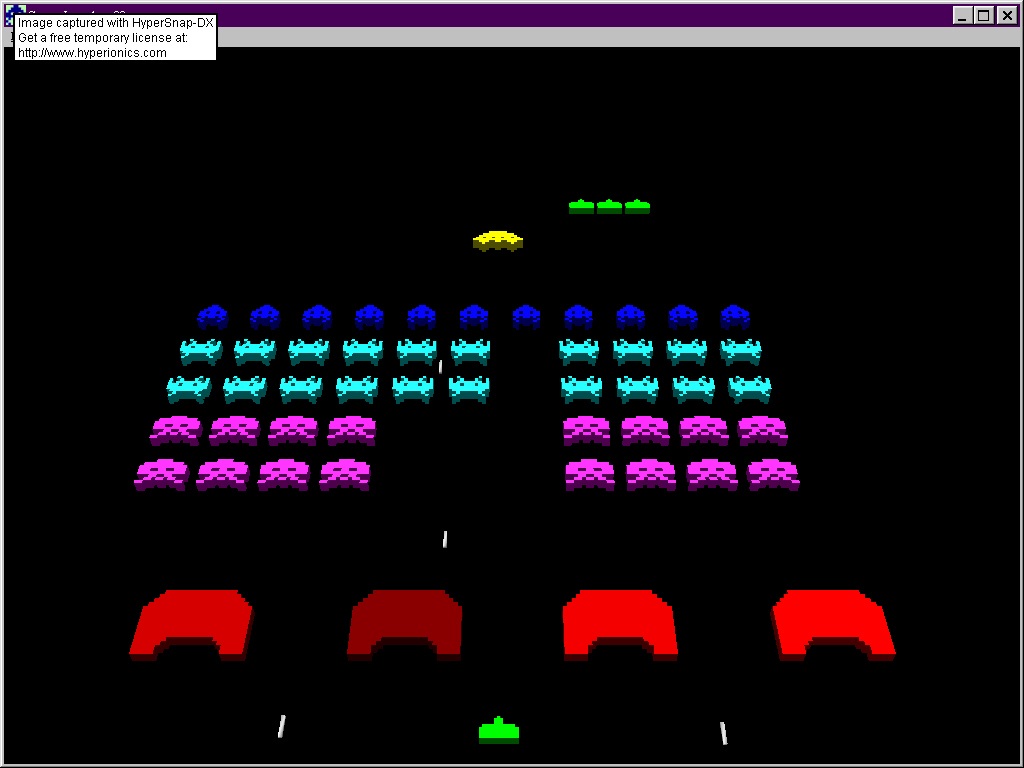
My Senior Project. A Microsoft DirectX based 3d version of the classic coin-op Space Invaders. I wanted to do something challenging that was a complete project from start to finish using an unknown API. Go here for my senior project journal and additional information/screen shots on how it went..
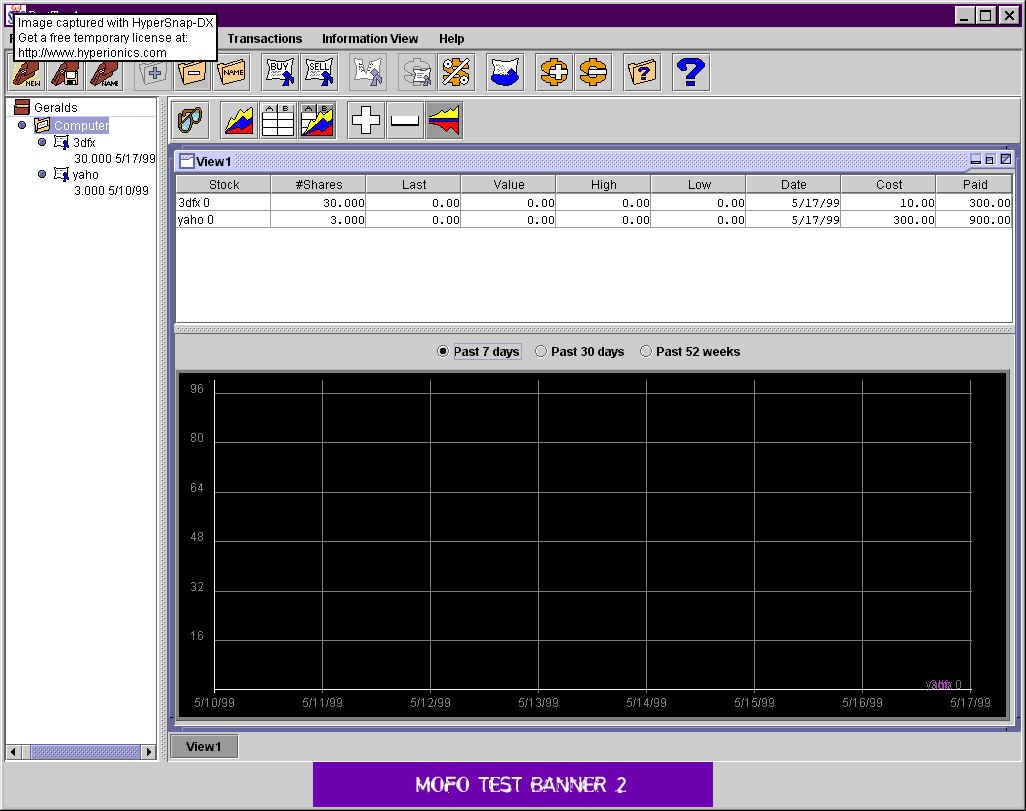
This Java-based internet stock portfolio tracker was developed as a result of working with fellow students in a software engineering course at Cal Poly, San Luis Obispo. It allows a user to create portfolios and store stocks in them for analysis and comparison. It creates graphs and reports many of the standard types of information typical of portfolio management software. It also pulls content off the internet to keep data and graphs up to date. E-mail me if you'd like to see it.
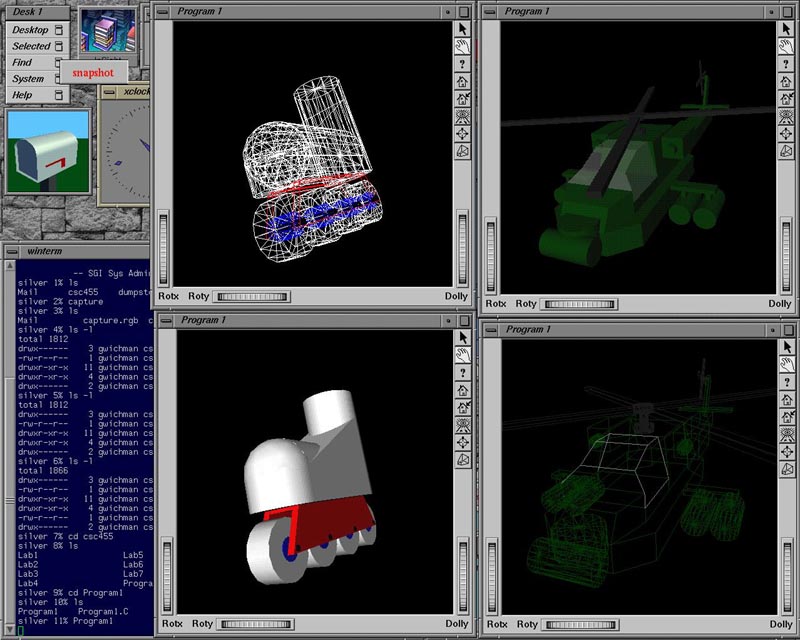
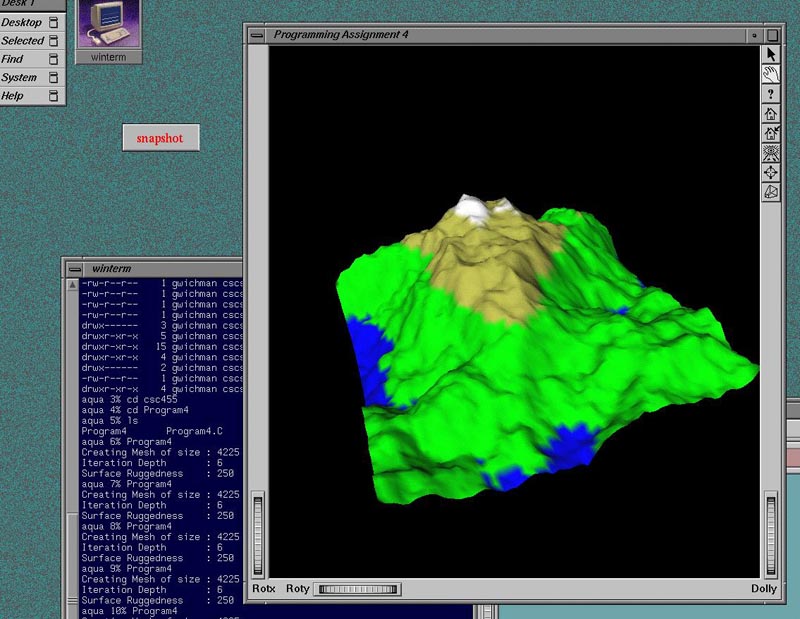
The first shot on the left shows two programs I created early in learning computer graphics. The leftmost one is simply a composition of various primitive objects (cylinders, spheres, and rectangles). It has one custom face set which is the trapezoidal shapes that make up the skate's chassis. The shot on the right shows the fractal landscape generator I wrote which takes a flat mesh and generates random fractal landscapes including coloring by height.
World War ][ is a BBS door game based on Milton Bradley's Axis and Allies strategic board game. Control one of the Axis or Allied powers, directing research, purchasing your weapons of war, and directing them against your opponents. Build everything from infantry to the mighty Battleships and Aircraft Carriers of World War 2. It is ANSi based and works similarly to the very popular Global Wars BBS door game but has much greater depth on all fronts. I developed this program by myself due to my interest in Milton Bradley's game and my dissatisfaction with the limitations of Global Wars (i.e. Risk). It was never quite finished (i.e. it is still buggy, but works) because my interest in completing it vanished when the internet popped up and BBS use dropped dramatically everywhere.
Job Searcher is a BBS door that allows the sysop to create a custom database of jobs available in any area. Users may then search through the database for jobs based on custom search criteria specified by them. Anyone offering jobs may add jobs to the database which don't appear until the sysop approves them for posting. This program was developed for a school to keep track of local jobs.
Orb Wars Map Maker is a utility I wrote for the Macintosh. Originally I became very involved playing Orb Wars which is a multiplayer game on GEnie online services. Back then it was possible to create a map for Orb Wars using a simple text editer but this was extremely tedious and involved using graph paper and spending many hours. As a project to learn Macintosh windows programming I decided to make a map making program that was as simple to use as any simple painting program. The program here is the result of my work It works extremely well and although it wasn't perfect I was very proud of the result.
Last updated 02/22/02
|